Street litter, mapped to the water it threatens.
The only public map that connects street litter to the drinking water it threatens — fusing resident reports, city 311 records, and EPA water-quality assessments with cited provenance.
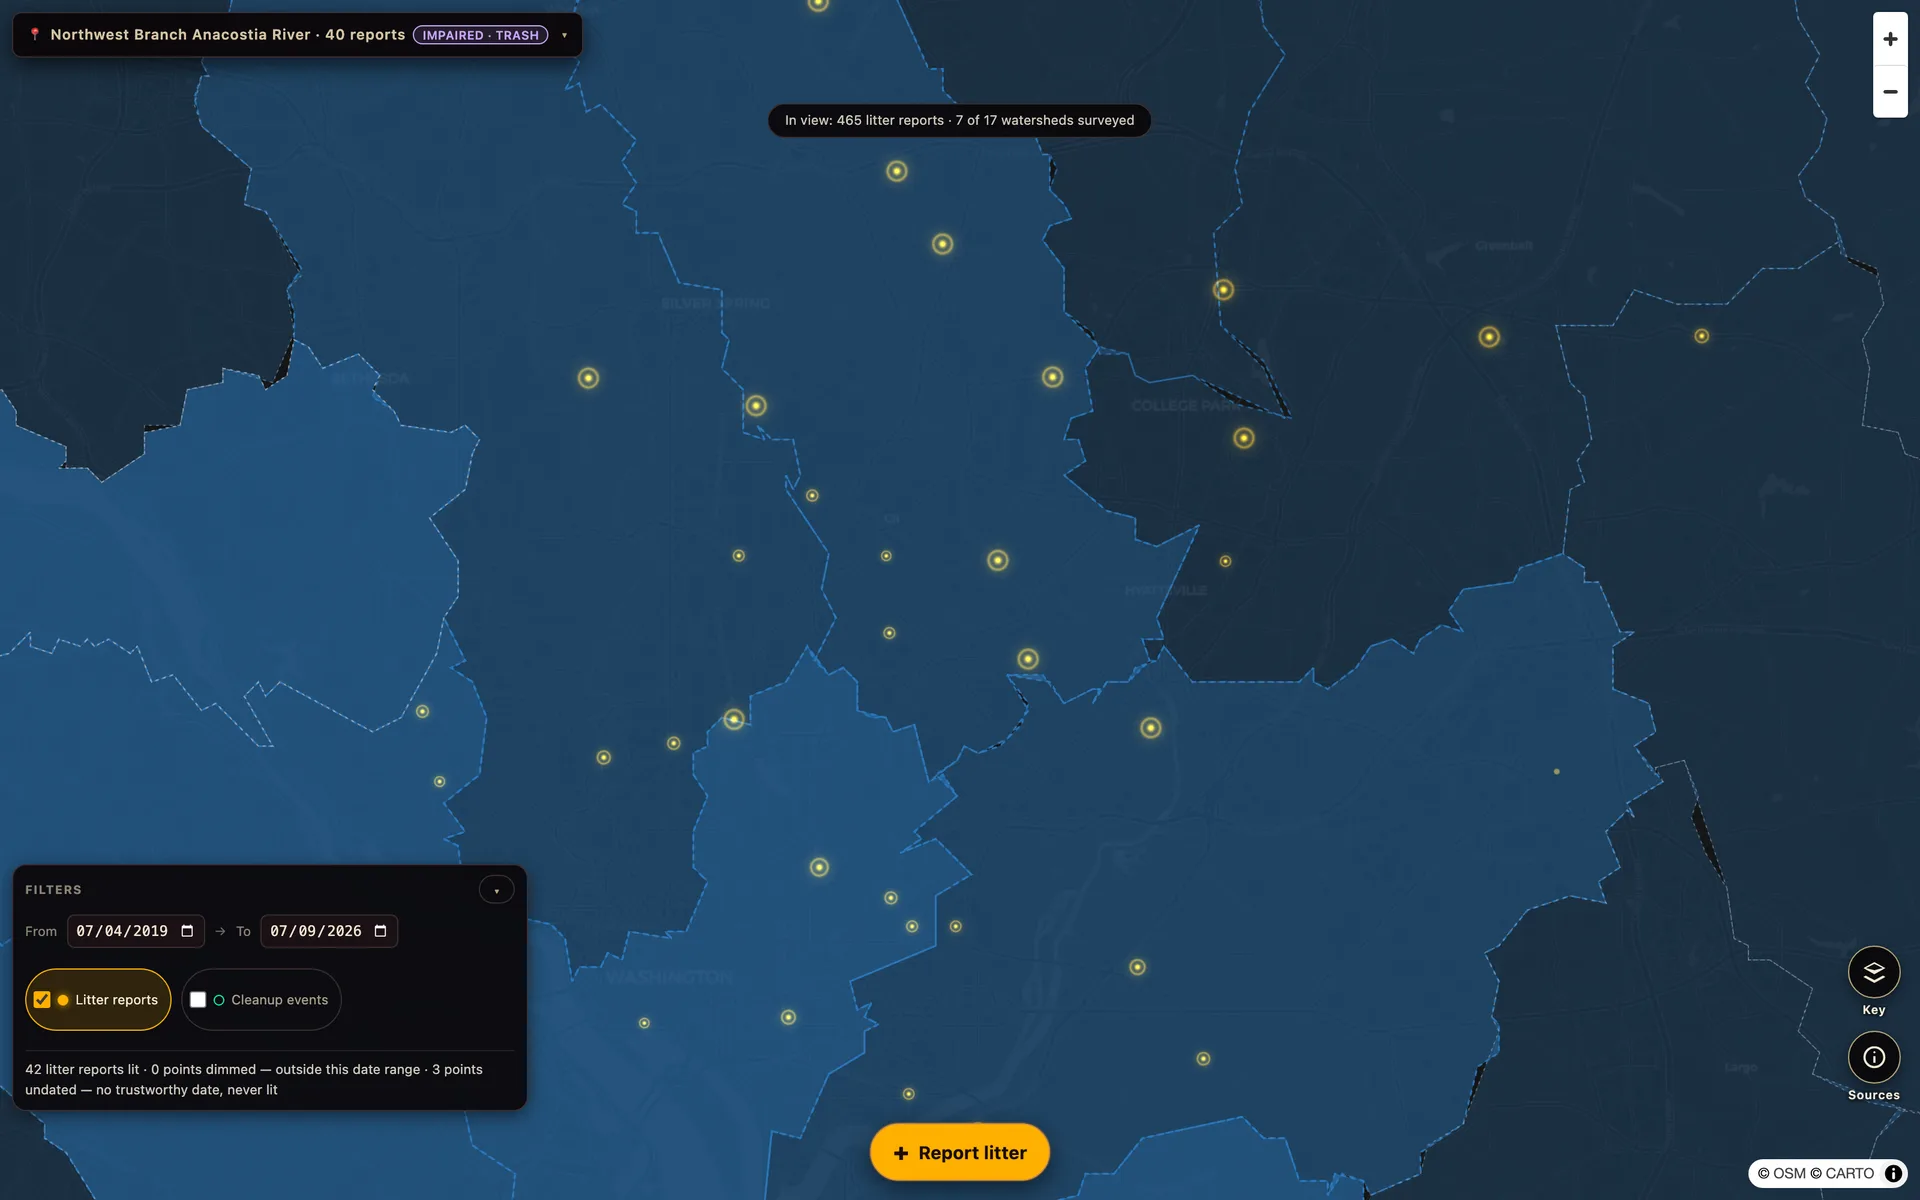 The live map, captured 2026-08-06 — Northwest Branch Anacostia, EPA-listed impaired for trash.
 Open the map and use it.
Explore without an account
The map is public. 550+ litter observations, with water status tracked for 16 watersheds in DC, Maryland, and Virginia — rendered as points of light over watershed boundaries on custom vector tiles.
See the water connection
Watersheds carry their EPA assessment status — the Anacostia branches show an impaired · trash badge straight from the EPA's ATTAINS listings. Tap a spot and the map names the drinking-water intake it drains toward, and the communities that intake serves.
Report litter
Photo, location, and reachability tags — could a small ground robot get to this? — plus optional hazard pins for broken glass or needles. New reports reach other viewers' maps in seconds.
Log what you picked up
Every litter report carries a cleanup ledger: "How much did you pick up?" in bag-sized buckets. With enough logged history a site shows its pace — and the estimator says "not enough data yet" rather than inventing a rate.
Crews, orgs & funder exports
Cleanup organizations can create crews, recruit volunteers so pickups count toward the org, record volunteer hours, and export their history in a funder-shaped report.
Take the data
The observation corpus publishes as versioned CC-BY-SA-4.0 GeoJSON snapshots — download it from the map's ⓘ Sources sheet, with license and provenance metadata alongside.
Fused sources, cited on the map.
Trash Trail doesn't ask you to trust it — the ⓘ Sources sheet cites provenance per watershed, with fetch dates. The live corpus fuses:
| Source | What it contributes |
|---|---|
| Residents | Photo reports with reachability tags and hazard pins, submitted on the map |
| DC 311 service requests | Municipal litter & illegal-dumping reports from opendata.dc.gov |
| OpenLitterMap | Volunteer litter observations, imported with attribution |
| Community & local news | Curated cleanup and hotspot records (Reddit, local press, civic groups) |
| EPA ATTAINS | Clean Water Act assessment status per stretch — including trash-cause impairments |
| USGS Watershed Boundary Dataset | The HUC-12 watershed geometry everything is organized by |
Honesty cues are part of the cartography: a solid watershed outline means the EPA has assessed it; a dashed outline means it has never been assessed — absence of data is drawn differently from a clean bill of health.
Litter doesn't stay where it falls.
Street litter moves with rain: gutter → storm drain → creek → river. The EPA's impairment listings make the endpoint concrete — stretches of the Anacostia are listed under the Clean Water Act with trash among the causes. Trash Trail puts that listing on the same map as the litter that feeds it, and names the drinking-water intake downstream.
That framing turns an eyesore into a stake: this pile isn't just ugly, it drains toward the water your city draws. And it gives cleanup work a measurable, cited "why here."
Small system, tight budget, real engineering.
The platform is proprietary; the data is open. The whole thing is engineered to run under a $5/month AWS budget — that constraint drives most of the interesting decisions.
Frontend
- React + TypeScript PWA, installable on phones
- MapLibre GL over PMTiles vector tiles — baked locally, served static; no tile server
- Custom WebGL additive-light "firefly" rendering for observations
- ~40 KB entry-bundle budget, enforced in CI
Backend
- 30+ AWS Lambda functions behind one HTTP API
- Aurora Serverless v2 (Postgres + PostGIS, scale-to-zero) as canonical store; DynamoDB serves the public read path
- Event-driven photo pipeline: EXIF scrub → litter detection → before/after cleanup diff
- Live updates: new reports reach other viewers in ~5 seconds via a version-keyed fresh overlay
Platform
- Six CloudFormation stacks, all AWS CDK — no console-built infrastructure
- GitHub OIDC deploys for the static surfaces; immutable versioned artifacts for tiles and data snapshots
- Budget alarms at $5 / $20 / $50 with cost-anomaly detection
- iOS shell (Capacitor, Swift PM) builds and runs; ready for App Store submission, enrollment pending
Closed platform, open commons.
The observation corpus is published under CC-BY-SA-4.0 as versioned, immutable GeoJSON snapshots with provenance metadata — use it, redistribute it, build on it. Download the current snapshot from the map's ⓘ Sources sheet. Contributor emails are never published.
Water-quality context stays with its upstream licenses: EPA ATTAINS and USGS WBD are public domain, cited per watershed.